

Stocks, Bonds and the Yield Curve
Part 1

You might have heard that stocks are at an all time high. You also might have heard that stocks perform well during periods of higher bond yields. Yes and no. Some stocks are at all time highs, others are well off their highs and still headed down. Some stocks benefit from higher rates and others hate them. It all depends why yields are rising and the shape and movement of the Yield Curve. Let us try to demystify these relationships and arrive at some logical conclusions about why different stocks respond differently to the same movement in bond yields and the yield curve.
First, how are individual stocks valued? In its simplest form, we can say that it depends on the projected cashflow that stock will generate over time for its shareholders, the rate of growth of earnings & profits over time, all discounted by (and compared to) an alternative source of riskless yield, which is the yield on government bonds. After all, a stock is simply a bond with no maturity, a perpetual with no fixed coupon. Its “coupon” (i.e.: dividend) will depend on the earnings and earnings growth that company will achieve over its lifetime, which is, of course, unlimited. Since the stock has an unlimited lifetime, its nearest comparison in the government bond world is the longest maturity traded bond: the 30yr. Just like a long bond is said to be long duration, so stocks, as an asset class, are also long duration. A very good definition of duration (not to be confused with time to maturity) can be found here: https://www.investopedia.com/terms/d/duration.asp
Now, not all stocks have the same duration. Take a well established company generating current profits, with very stable earnings, predictable earnings growth and dividends. Something like $PG. The cashflow it will generate for its shareholders is stable and predictable, so an upward move in long bond yields will affect its stock price relatively little. You discount the earnings stream into the future and a relatively small upward movement in bond yields will have a relatively small overall effect on the mathematical result. That kind of company tends to be low beta (https://www.investopedia.com/terms/b/beta.asp). But take another company that has no current profits and where all earnings growth and hence profits (at some stage...hopefully) are well into the future. Something like $PLTR or even ARKK, the ETF that invests in “technological disruptors” whose technologies will develop in many years’ time, if not decades. These are high beta stocks with very high duration. A relatively small movement in long bond yields will have a much larger effect on the discounting simply because the perceived cashflow they will generate is all much further out into the future. The mathematics is quite simple and available here: https://en.wikipedia.org/wiki/Stock_duration
Now take a bank stock, something like $JPM. A bank is simply a machine for transforming short term money into long term money. It takes short term deposits from retail customers or from the wholesale money markets and lends them to companies or individuals as long term fixed rates. Something like a 10 year loan to a company to build a new plant or a 30 year mortgage for an individual to buy a house. The steeper the yield curve and the higher the long bond rate, the greater the spread and hence the profit the bank will make, ceteris paribus.
Below we have the price charts for $PG, $PLTR, ARKK and $JPM.

We can see that in the case of $PG the stock price started declining earlier, at the same time as long bond rates started rising. But its fall is relatively muted. The market is assuming that faster growth in the economy will result in very little additional revenue for $PG (you wash your hair just as often and use the same number of tampons regardless of economic growth rates). Therefore, the discounting effect starts immediately but is muted.

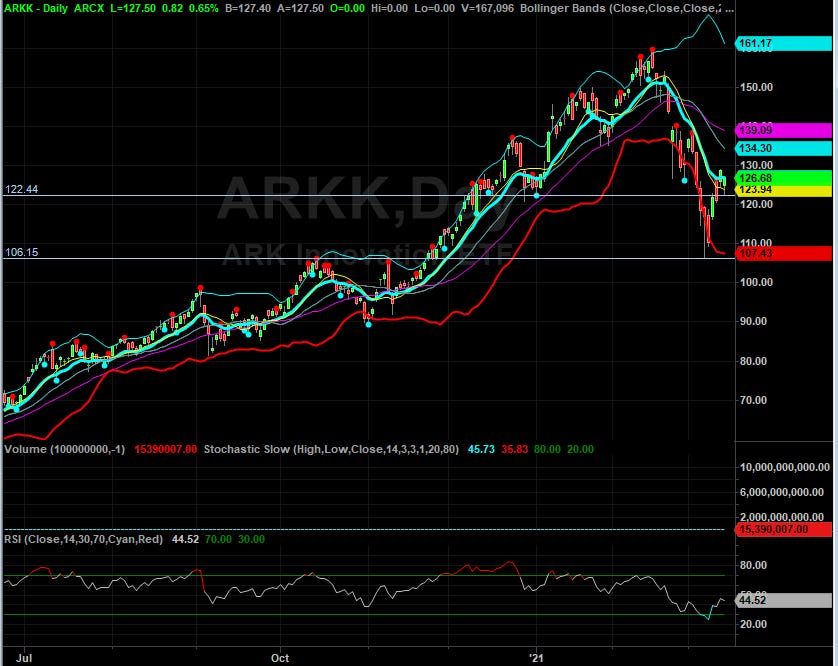
$PLTR on the other hand was the subject of a small mania. People assumed that faster growth would translate into higher revenue immediately and drove the price to unsustainable multiples. As soon as the market ran out of overoptimistic fools, the price collapsed 50% in days. The pull of higher duration obliterated higher growth hopes. Unless higher sales translate into higher earnings and profits sooner than currently expected, the gravitational pull of higher bond yields will ensure that the price continues to languish or decline for a long time ahead. The chart of ARKK is very similar, for exactly the same reasons. (PS: I am not arguing that these assets will necessarily decline in price. But they will only rise when the market concludes that profitability and/or earnings growth will come sooner or be larger than currently expected. Or long bond yields fall.)

There is no stopping $JPM. It loves the steeper yield curve and also the fact that higher growth equates to lower loan losses in the future and that current loss provisions, made during the COVID pandemic, will likely become performing again, going straight to the bottom line once more. Higher bond yields can’t touch it. Unless the yield curve flips negative.
In Part 2, I will go deeper into the current absolute levels of government bonds, the Yield Curve, S&P Sectors and how to construct stock portfolios for every kind of bond market environment.
Never forget: the only thing that can kill an equity market bull is the bond market. But there is always a bull market going on in something, even if it’s only Puts.
Very elegant explanation of how The bond yields effect different stocks.
Thanks Nick. You were the first one that I heard talking about this when growth stocks took off last March.